solution · finops
Operational cost intelligence for engineering organisations.
Understand what drives infrastructure cost across services, ownership, workloads, deployments, and operational systems.
Move from disconnected billing data to operational cost understanding.
- Engineering leadership
- Platform engineering
- Infrastructure leadership
- FinOps practitioners
- CTO
- VP Engineering
02 · the visibility gap
Cloud spend becomes hard to manage without operational context.
Engineering organisations struggle to understand cloud cost when ownership, infrastructure, workloads, deployments, and operational systems fragment across tooling and teams. The bill is real, but the operational story behind it is scattered.
Billing visibility alone does not explain operational impact. Cost without operational context creates bad decisions, and FinOps work drifts behind the engineering systems it is meant to govern.
-
Disconnected billing data
Cloud invoices, account-level rollups, and tag-based exports describe what was spent. They do not describe the engineering systems, deployments, or operational behaviour that drove the spend.
-
Ownership ambiguity
Cost rolls up by cloud account or tag, not by the team accountable for the workload. Spend conversations end in a routing meeting before they reach a decision.
-
Operational blind spots
Onboarding events, scaling activity, regional tests, and dependency drift move infrastructure cost in real time. Billing exports surface the change a month later, with the operational story stripped out.
-
Optimisation confusion
Generic recommendations rank by saving size alone. Engineering teams cannot tell which suggestions are safe, which touch critical workloads, and which are simply not worth the change.
03 · operational drift becomes financial risk
Cloud waste is often an operational coordination problem.
Cloud cost issues rarely come from poor purchasing or missing billing dashboards. They surface from forgotten test environments, zombie infrastructure, orphaned storage, idle Kubernetes node pools, duplicate regional capacity, underutilised GPU workloads, compromised workloads, unclear ownership, and temporary infrastructure that quietly becomes permanent.
These are operational coordination failures, not finance failures. The industry research lines up with what engineering organisations already feel inside their own platforms.
- · Forgotten test environments
- · Zombie infrastructure
- · Orphaned storage
- · Idle Kubernetes pools
- · Duplicate regional capacity
- · Underutilised GPU workloads
- · Unclear ownership
- · Temporary turning permanent
-
Unauthorised compute abuse
Microsoft has documented cryptojacking cases where compromised cloud workloads generated more than $300,000 in unauthorised compute fees.
Microsoft Security · 2023 -
Public cloud waste
Broadcom's 2025 cloud research reports 49% of organisations estimate more than 25% of public cloud spend is wasted, and 31% believe waste exceeds 50%.
Broadcom · 2025 Private Cloud Outlook -
Spend management pressure
Flexera's 2025 State of the Cloud research found managing cloud spend remains the top cloud challenge, cited by 84% of organisations.
Flexera · 2025 State of the Cloud
04 · context, not just cost
Not all infrastructure growth is waste.
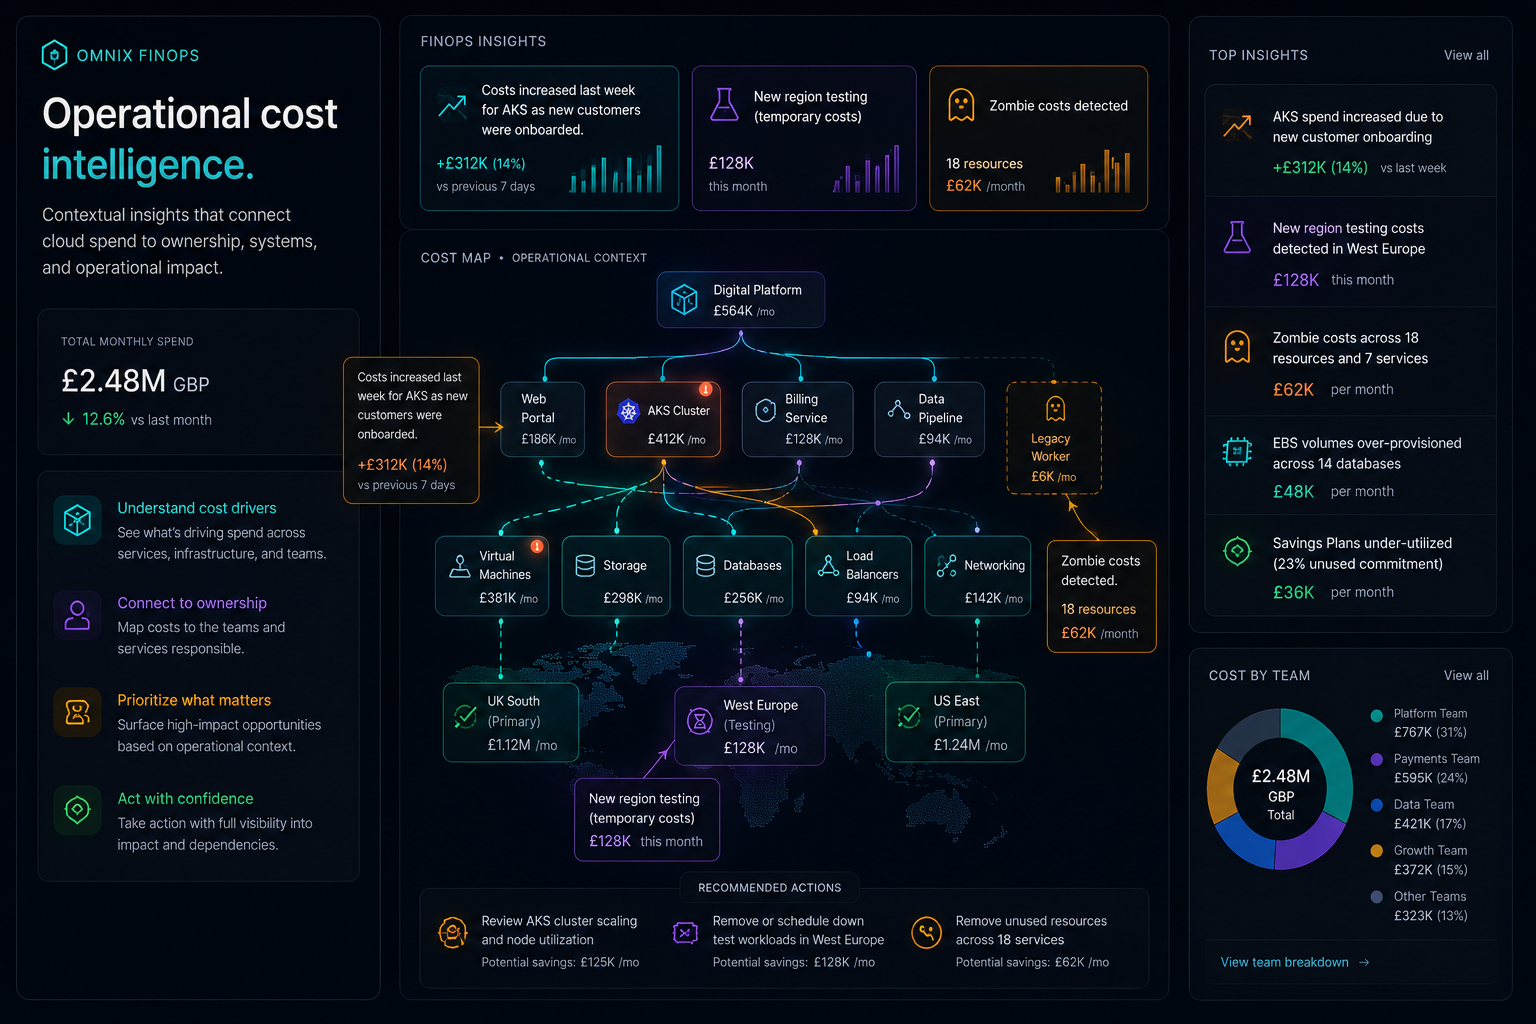
Infrastructure cost only becomes meaningful when connected to operational context. Increased AKS utilisation may indicate healthy customer growth. Regional capacity may support resilience testing. GPU spikes may reflect legitimate inference demand.
Context determines whether spend is healthy scaling, temporary drift, or waste. Omnix surfaces the difference, so engineering teams act on the change that matters instead of chasing every line that moves.
-
Healthy scaling
AKS cost increased 18% week-over-week following enterprise customer onboarding.
-
Operational drift
Temporary EU failover environment remained active 11 days beyond resilience validation.
-
Anomaly requiring review
GPU-enabled workloads show sustained overnight utilisation outside production traffic patterns.
-
Unowned infrastructure
Zombie Kubernetes node pool identified in a legacy testing namespace.
-
Optimisation opportunity
Reserved capacity utilisation dropped following a regional migration.
Omnix connects infrastructure cost to services, ownership, dependencies, deployments, and operational behaviour, so teams understand not just what costs money, but why.
05 · contextual finops
Understand why costs change.
Cost movements have operational causes. Customer onboarding scales AKS, a new region test runs for two weeks, a deployment leaves zombie infrastructure behind. Omnix connects infrastructure cost to workloads, services, deployments, ownership, and operational activity, so the line on the chart reads as the operational event behind it.
FinOps stops being a reconciliation exercise and starts being an operational decision rooted in context. Engineering teams see cost the same way they see the rest of the operational state of their systems.
-
Onboarding-driven scaling
AKS, compute, and data services scale with customer onboarding. Cost growth reads as a deliberate operational event, not an unexplained line on a chart.
-
Temporary regional cost
New region testing, migration spikes, and short-lived environments are visible as bounded operational activity, so they stop looking like permanent regressions.
-
Zombie infrastructure
Idle, abandoned, and orphaned resources surface against ownership and dependencies, so removing them is a confident operational decision instead of a blame search.
-
Workload inefficiency
Underutilised compute, oversized clusters, and inefficient workloads land alongside the services they support, so efficiency conversations stay grounded in operational reality.
06 · operational insights
FinOps insights with operational reasoning.
Most FinOps tools surface spend. Omnix explains operational causes. Insights arrive grounded in the systems, deployments, and teams behind the cost, with the reasoning attached for the engineers accountable for the work.
-
AKS cost growth tied to onboarding
Scaling activity reads against the customers, services, and deployments behind it. Engineering leadership stops asking why the bill moved and starts deciding what the movement means.
-
Test environment visibility
Regional tests and short-lived environments are visible as deliberate operational activity, with a clear runway and an accountable team, not as anonymous spend.
-
Zombie costs detected
Idle, abandoned, or orphaned resources are surfaced with ownership context, so cleanup work goes to the team that owns the system instead of bouncing across queues.
-
Underutilised commitments
Savings plans and reservation utilisation are read against actual workloads, so commitment decisions reflect operational reality rather than last quarter's forecast.
- · Infrastructure-aware insights
- · Ownership-aware optimisation
- · Contextual prioritisation
- · Operational cost propagation
- · Dependency-aware understanding
- · Engineering accountability
07 · ownership & accountability
Connect infrastructure spend to ownership.
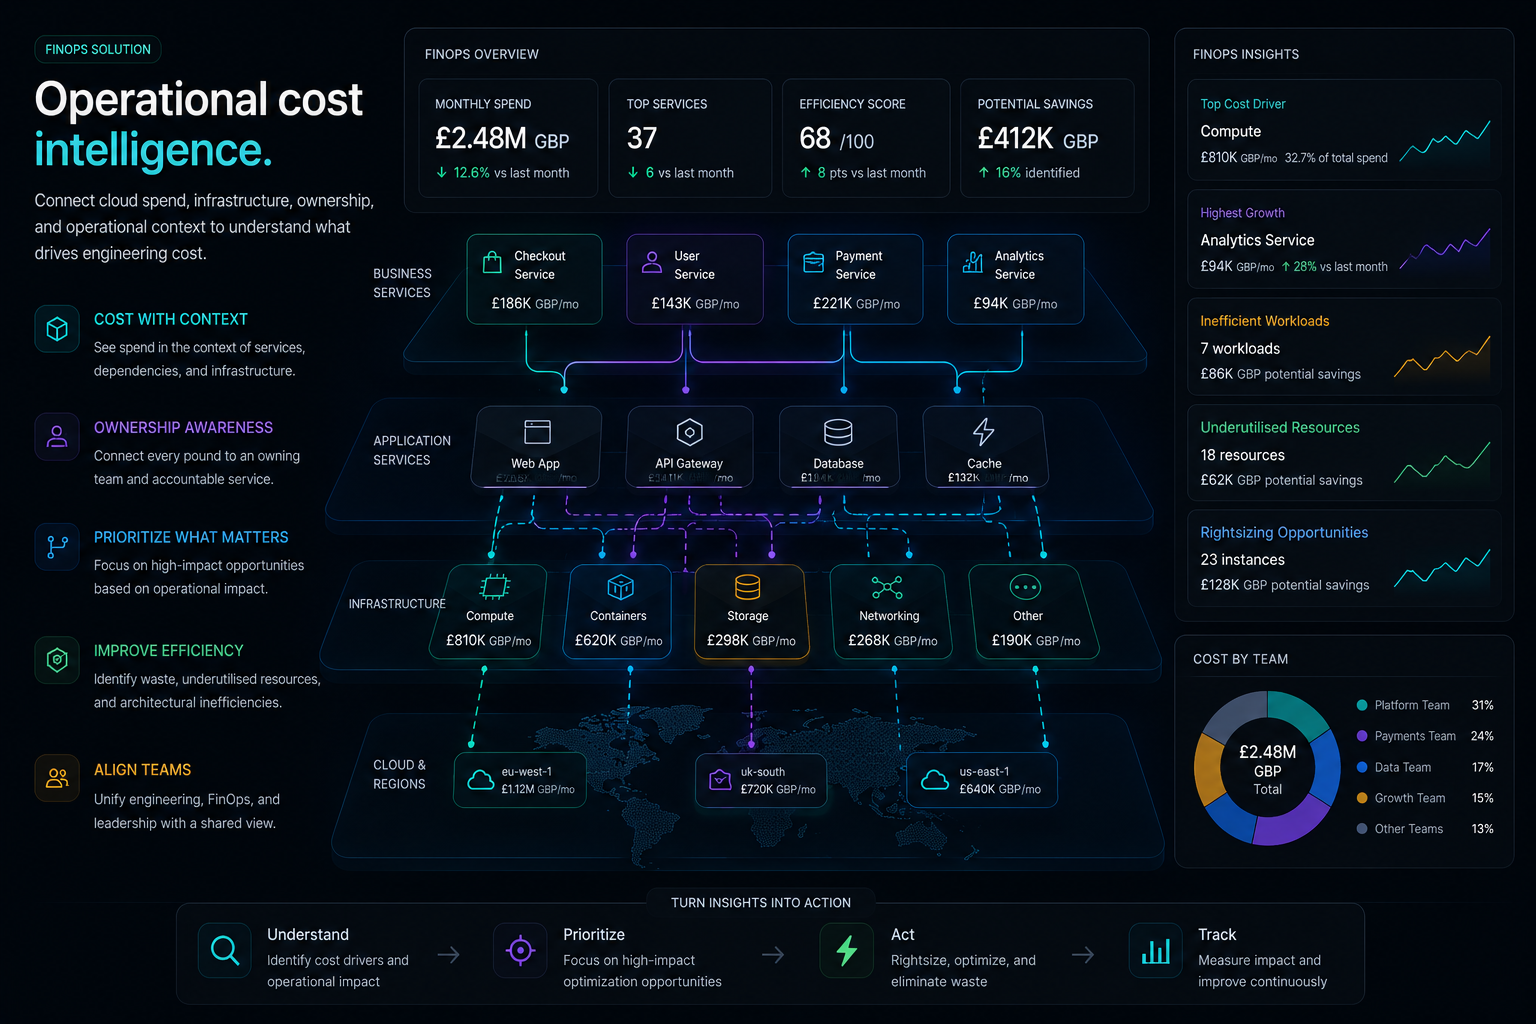
FinOps becomes operationally effective when teams understand what systems they own, what infrastructure they consume, and how operational behaviour impacts cost. Allocation stops being a tagging exercise and starts being an operational fact attached to the work.
Cost rolls up by service, by application, by team, and by product, all against the same ownership records that power the rest of the operational graph. Engineering teams see operational cost the same way they see operational state.
-
Cost by service
Spend reads against the services it actually powers, so engineering teams see operational cost the same way they see operational state.
-
Cost by team
Each team's footprint is visible against the same ownership records that power the rest of the operational graph. Allocation stops being a spreadsheet exercise.
-
Cost by product
Infrastructure rolls up onto the products it supports, so trade-off conversations between business value and operational cost happen with the same context attached.
-
Engineering accountability
Ownership-aware cost makes operational behaviour the substrate of FinOps. Optimisation work routes to engineers with the context to evaluate it instead of a generic queue.
08 · optimisation prioritisation
Prioritise optimisation that matters.
Not every optimisation creates meaningful operational value. A large saving on a critical workload is not the same opportunity as a larger saving on a service nobody owns. Saving size in isolation is not a prioritisation strategy.
Omnix ranks optimisation opportunities using workload importance, ownership, operational impact, dependencies, and infrastructure relationships. The work that lands first is the work that matters first, with the operational context that makes it safe to do.
-
Operational relevance
Optimisation candidates rank against the workloads they touch and the products those workloads power, so the work that lands first is the work that matters first.
-
Dependency-aware optimisation
Upstream and downstream relationships are part of the picture. A right-sizing change on a quiet service that powers a critical product is treated like the change it actually is.
-
Ownership-aware routing
Recommendations route to the engineers who own the affected services, with operational context attached. Optimisation moves from queue to action.
-
Operational tradeoffs
Saving size reads alongside reliability impact, deployment frequency, and operational posture, so optimisation decisions reflect the full operational picture.
09 · engineering & finops alignment
Align engineering and FinOps around operational context.
Engineering teams, platform teams, infrastructure teams, and FinOps organisations operate more effectively when they share contextual operational understanding. Coordination stops being a tax that one side pays to bring the other up to speed.
Omnix gives every side the same operational picture: ownership, dependencies, deployments, workloads, and spend, read together. Cost conversations move forward because the substrate is shared, not because one team finally produced the right spreadsheet.
-
Cross-team coordination
Engineering, platform, infrastructure, and FinOps work from the same operational view of cost, so coordination becomes a shared practice instead of a recurring meeting.
-
Operational alignment
Cost priorities and engineering priorities reconcile against the same operational reality, so trade-offs happen with context instead of in isolation.
-
Organisational visibility
Leadership sees spend, ownership, efficiency, and optimisation progress across the engineering organisation, so cost posture becomes legible at the level it is funded.
-
Shared operational understanding
The picture FinOps operates against is the picture engineering operates against. Cost conversations move forward because the substrate is the same.
10 · ai & context
AI that understands operational cost context.
Omnix AI reasons across infrastructure, ownership, deployments, workloads, dependencies, and operational systems to surface meaningful optimisation and operational efficiency understanding. Generic AI gives you confident answers. Contextual AI gives you operationally correct ones.
-
Contextual reasoning
Reasons across ownership, dependencies, deployments, workloads, reliability, and operational state together, so optimisation is operationally meaningful, not generically large.
-
Operational awareness
Understands which services power which products, who owns what, and how cost propagates, so suggestions arrive grounded in the systems they touch.
-
Optimisation prioritisation
Connects spend to the operational picture so the most consequential efficiency work surfaces first, with context attached for the engineers accountable for it.
11 · outcomes
Operational cost visibility at organisational scale.
What changes when infrastructure spend, ownership, dependencies, and optimisation share a single operational context instead of fragmenting across systems and teams.
-
Better optimisation prioritisation
-
Reduced operational blind spots
-
Faster cost coordination
-
Improved ownership visibility
-
Better engineering / FinOps alignment
-
Operational efficiency understanding
-
Reduced cost ambiguity
-
Calmer infrastructure cost posture
12 · beyond cloud cost dashboards
Beyond cloud cost dashboards.
Traditional FinOps tooling
- · Billing visibility
- · Generic recommendations
- · Static reporting
- · Fragmented ownership
- · Limited operational context
- · Spreadsheet-driven FinOps
Omnix FinOps
- → Operational cost intelligence
- → Context-aware insights
- → Ownership-aware optimisation
- → Dependency-aware prioritisation
- → Engineering operational understanding
- → Actionable, contextual prioritisation
Most tools give engineering organisations a cost report.
Omnix gives engineering organisations an operational cost intelligence layer.
see it in action
See operational cost intelligence across your engineering organisation.
Book a 30-minute walkthrough. We'll show you what FinOps looks like when infrastructure cost, ownership, workloads, deployments, and operational activity share one connected picture, framed for the way engineering and FinOps leadership actually run cost at scale.
- Read-only access. We never push, comment, or merge.
- SOC 2 Type II in progress. Audit period H2 2026.
- Code stays in your VCS. We read metadata, not your repo contents.